Your Guide to Effective Supply Chain Visualization with Infographic Templates
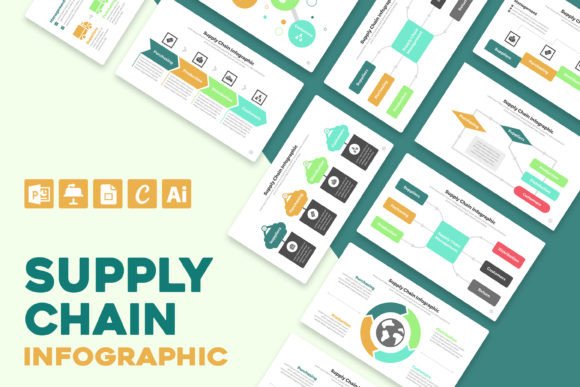
Communicating the complexity of a supply chain is a challenge every manager, educator, and entrepreneur faces. A simple list or a dense spreadsheet often fails to capture the dynamic flow of materials, information, and people. This is where a well-designed Supply Chain Infographic Template becomes an indispensable tool. It transforms abstract processes into a clear, visual story that everyone—from stakeholders to team members—can immediately understand.
Why Visualizing Your Supply Chain Matters
An infographic does more than just decorate a presentation. It serves a critical function: simplification through design. When you attempt to explain a multi-stage process involving sourcing, manufacturing, logistics, and distribution, words alone can create confusion. A visual template forces you to distill the essence of the chain. It highlights dependencies, pinpoints potential bottlenecks, and, crucially, humanizes the process by showing the roles involved. This isn't about making a pretty picture; it's about creating a shared reference point that aligns understanding and drives better decision-making across your organization or classroom.
Common Oversights When Choosing a Template
Many people rush to download the first attractive template they find, which often leads to frustration and wasted time. The most frequent mistake is selecting a template based solely on its aesthetic appeal without considering its structural fit for your specific message.
Mistake: Prioritizing Style Over Narrative Structure
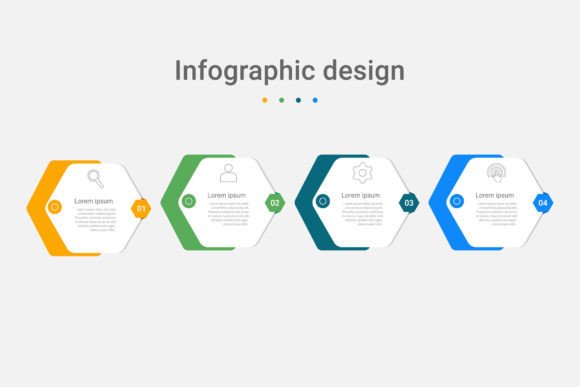
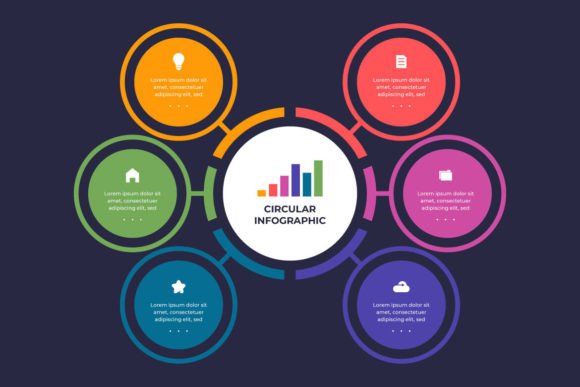
A template with dazzling icons and colors might catch your eye, but if its layout is a simple linear flowchart, it may utterly fail to represent the cyclical or network-based nature of your actual supply chain. For example, a circular template illustrating a continuous loop of feedback and improvement is far more effective for a sustainable or remanufacturing process than a straight-line diagram. The mismatch forces you into contorting your data, resulting in an infographic that is confusing rather than clarifying.
The Better Approach: Before you evaluate design, analyze the core story you need to tell. Is it a journey from raw material to customer? A map of global partners? A breakdown of cost allocation across stages? Match the template’s inherent layout—its skeleton—to this narrative first. The professional, clean design offered in a good Supply Chain Infographic Template pack should serve this structure, not overshadow it.
Mistake: Ignoring True Editability and Software Lock-In
The term "editable" can be misleading. Some templates are merely arranged images in a PDF, allowing only text changes. True editability means you can modify colors, shapes, connector lines, and icon placements to reflect your unique chain. A critical detail often overlooked is software compatibility. A template provided only in PowerPoint (.PPTX) might be unusable for a team standardized on Google Slides or for a designer who prefers Adobe Illustrator for advanced customization.
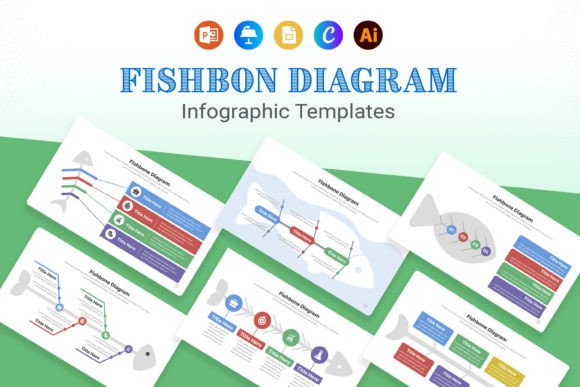
The Practical Check: Always verify what "easy to edit" actually means. Look for packs that provide multiple native file formats—like PPTX, Google Slide, Apple Keynote, and Adobe Illustrator EPS—as mentioned in quality offerings. This ensures that regardless of your team's preferred tool or your future need for high-resolution print customization, you aren't starting from scratch. Also, confirm the use of free fonts, so you don't face licensing issues or missing typefaces when you open the file.
Applying the Template Effectively: Beyond Dropping in Text
Once you have a suitable template, the next pitfall is treating it as a simple fill-in-the-blank exercise. The goal is to create a powerful image of the industry and its diverse people, not just a labeled diagram.
Mistake: Omitting the Human Element and Role Clarity
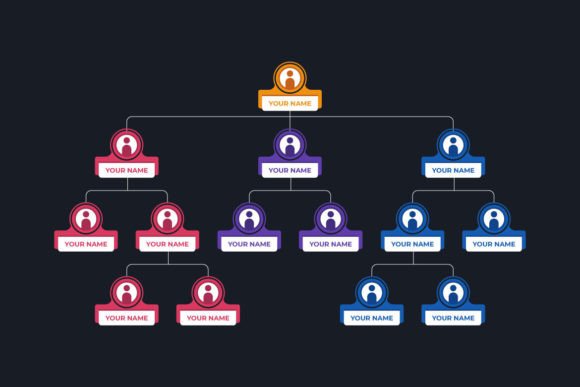
Supply chains are operated by people. A template that includes placeholder figures or icons for roles—like a purchaser, quality inspector, or logistics coordinator—is a goldmine. Yet, many users simply label a stage "Manufacturing" and move on. This misses the opportunity to show collaboration and assign accountability. The images in a robust template demonstrate the huge range of people involved; each person represented by a number with their role explained. Use this feature. Annotate not just the process step, but who performs it and what their key responsibility is. This builds empathy and operational clarity for viewers.
How to Use It Well: Follow the template's lead. If it provides numbered role icons, populate them with real job titles or team names from your chain. Explain briefly how each role contributes, showing why people work so hard at that juncture. This turns a process map into a stakeholder map, which is invaluable for training and inter-departmental communication.
Mistake: Overloading with Data, Underdelivering on Insight
In an effort to be comprehensive, users often cram every metric, supplier name, and time estimate into the infographic. This creates visual clutter that obscures the main message. The template is a framework for curated communication, not a repository for all raw data.
The Solution-Focused Method: Decide on one or two key insights per major stage. For the "Sourcing" stage, perhaps highlight your lead time and primary supplier location. For "Distribution," you might visualize your delivery network coverage. Use the template's design elements—like contrasting colors or bolded numbers—to emphasize these insights. The collaboration and best practices you want to show should be illustrated through simple callouts or connecting arrows, not paragraphs of text.
What to Verify Before Your Final Decision
Making an informed choice saves you time and ensures the template provides a tailored solution to fit your company’s needs. Here is a quick checklist to run through before purchase or download.
- Scope of Editability: Can you change core elements like color schemes and icon sets, or only the text? Does the pack include vector files (EPS/AI) for deep customization?
- Instant Download & Completeness: Ensure files are available immediately after purchase and that the package includes the promised formats and a help file or documentation.
- Narrative Alignment: Does the template's visual layout (linear, circular, network, hierarchical) naturally fit the story of your supply chain?
- Humanization Capability: Does it include elements to represent roles, teams, or collaboration points that you can adapt?
- Output Readiness: Consider your final use. If it's for a large presentation screen, all formats will work. If for high-quality print or embedding in a brand document, the Adobe Illustrator files are essential.
Remember, a Supply Chain Infographic Template is a starting point, not an automatic solution. Its power is unlocked by your thoughtful adaptation. By avoiding the common traps of mismatched structure, superficial editing, and data overload, you transform a generic template into a compelling, clear, and human-centered visual of your unique operation. It becomes not just a slide in a deck, but a fundamental tool for alignment, analysis, and communication across your entire network.