Fishbone Diagram Infographic Templates: A Guide to Choosing and Using Them Wisely
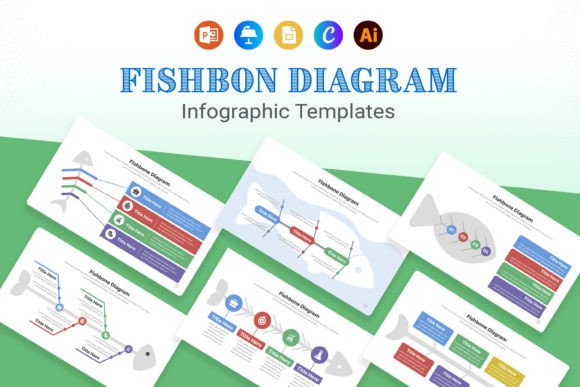
If you’re looking for a way to visually explain your process or product, the appeal of a Fishbone Diagram Infographic Template is obvious. These tools promise to make it simple to create a beautiful, engaging infographic that your audience will love, perfect for any industry. The idea is straightforward: grab a template, plug in your content, and start telling your story more effectively. However, the journey from downloading a template to achieving a truly impactful result is where many users stumble. Understanding what makes these templates genuinely useful—and what can trip you up—is key to leveraging them successfully.
The Core Purpose: Beyond Just a Pretty Diagram
A fishbone diagram, also known as a cause-and-effect or Ishikawa diagram, is a powerful analytical tool designed to systematically explore the root causes of a problem or the contributing factors to a process. Its strength lies in its structured visual logic. Therefore, a Fishbone Diagram Infographic Template should serve as a scaffold for that logic, not just a decorative shell. A common oversight is treating the template merely as a design shortcut, focusing solely on making the output “eye-catching” while neglecting the rigorous thinking the diagram requires. The infographic’s primary job is to communicate clarity, not just aesthetics.
For example, using a template to create a sales pitch about your product’s benefits is a valid application, but if you simply list features on the “bones” without showing how they interconnect to solve a customer’s core problem, the diagram loses its analytical power and becomes a glorified bullet-point list. The better approach is to use the fishbone structure to map out customer pain points (the “head” of the fish) and how your product’s various components (the “bones”) address each one specifically. This turns a sales tool into a persuasive communication of solution architecture.
Overlooking Editability and Compatibility
Templates often advertise being “easy to edit” in popular software like PowerPoint, Google Slides, or Illustrator. A mistake many beginners make is not verifying the true extent of this claim before purchase or download. “Easy to edit” can sometimes mean only color and text are changeable, while the underlying structure—the number of “bones,” their angles, or the core layout—is locked. For a project requiring a deep analysis with eight root cause categories, a template fixed at six branches becomes useless.
Practical advice: Before committing, check the description for specifics. Look for phrases like “fully editable vectors” or “100% customizable structure.” If possible, preview a sample or check for a list of editable elements. Ensure the template format (PPT, AI, etc.) matches the software you and your team actually use proficiently. A beautifully designed Illustrator file is no help if your workflow is built in Google Slides.
Misjudging “Professional, Clean Design”
The promise of a professional design is enticing, but professional design must align with your context. A template with a stark, minimalist aesthetic might be perfect for a tech startup’s internal process analysis but could feel cold and impersonal for a healthcare infographic aimed at patient education. Conversely, a template with playful icons and bright colors might engage students but undermine the seriousness of a quality control report for manufacturing.
The better choice is to assess the template’s visual language—its color palette, font styles, iconography—against your audience’s expectations and your brand’s tone. Don’t assume “professional” means universally appropriate. Sometimes, purchasing a slightly more niche template tailored to your field (education, healthcare, retail) yields better communication results than a generic one.
The Instant Download Rush
With files available immediately after purchase, the temptation is to dive straight into editing. This often leads to skipping a crucial planning phase. You open the template and start filling branches with ideas haphazardly, which can result in a cluttered, unbalanced, or logically inconsistent diagram. The template is a tool, not a replacement for thought.
To avoid this, treat the download as the start of your process, not the middle. First, define the problem or process statement clearly (the “head” of the fish). Then, brainstorm and categorize your major cause groups (the main bones). Only after this groundwork should you open the template and begin mapping your pre-organized content onto it. This ensures the template serves your structured analysis, not the other way around.
Font and Visual Consistency Issues
Many templates wisely use free fonts to avoid licensing problems for users. However, a mistake is not verifying the font’s availability or your willingness to install it. If the template uses a niche free font you don’t have, and you substitute it with a default system font like Arial, the entire typographic harmony and professional look can disintegrate.
Check the “What’s Inside” details for the font name. Download and install it before you begin editing to maintain visual integrity. Furthermore, while templates provide icons and graphical elements, overloading your diagram with too many disparate styles of icons can create visual chaos. Stick to the icon set provided within the template, or ensure any additions you make match its style closely.
What to Check Before Making Your Decision
Evaluating a Fishbone Diagram Infographic Template requires looking past the marketing promises. Here are key points to consider:
- Scope of Editability: Can you add, remove, or reposition the primary “bones”? Can you change the core layout (spacing, alignment, head shape)?
- Real-World Examples: Does the vendor show the template applied to different real scenarios (e.g., a service breakdown, a product development map)? This demonstrates versatility.
- Software Depth: “Editable in PowerPoint” can range from simple text boxes to fully manipulatable SmartArt. Understand the level of control you’ll have.
- Audience Fit: Does the design’s mood—formal, creative, technical—suit your specific audience and communication goal?
- Supporting Resources: Are there brief instructions, a suggested workflow, or a link to a guide on how to conduct a proper fishbone analysis? A template that educates its use is more valuable.
A Balanced Approach to Telling Your Story
The ultimate goal is to stand out from the crowd with clear, compelling communication. A Fishbone Diagram Infographic Template can indeed help you achieve that, but its success hinges on you being a thoughtful architect, not just a decorator. By selecting a template with the right flexibility for your needs, planning your analysis thoroughly before touching the design, and maintaining strict visual and logical consistency, you transform a ready-made asset into a powerful, custom tool. It bridges the gap between complex information and audience understanding, which is the true heart of effective storytelling. So, before you grab that template today, take a moment to plan your story’s structure. The template will then help you tell it beautifully.