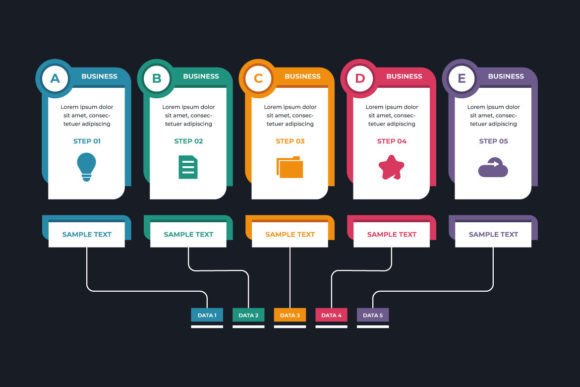
The Power and Pitfalls of Colorful Flat Infographics
In an information-rich world, clarity is currency. This is where the appeal of a Colorful Flat Infographic lies. This visual style, characterized by simple shapes, bold color palettes, and a minimalist, two-dimensional aesthetic, offers a powerful tool for transforming complex data or convoluted processes into an accessible, engaging snapshot. For entrepreneurs, marketers, educators, and professionals, it promises a shortcut to understanding—a way to encapsulate the essence of a thriving business, a strategic roadmap, or a multi-step journey into a single, compelling graphic.
However, the simplicity of the "flat" design can be deceptive. Many people dive into creating or selecting a Colorful Flat Infographic with enthusiasm but overlook the strategic depth required to make it truly effective. This often leads to visuals that are colorful but confusing, simple but superficial, ultimately failing to communicate or, worse, miscommunicating the core message.
Mistake 1: Confusing Simplicity with Lack of Substance
A common misunderstanding is that "flat" design only pertains to the visual style. People often prioritize making the infographic look clean and modern, using harmonious colors and simple icons, but neglect the underlying informational architecture. The result is a visually pleasing graphic that lacks a logical flow. For example, an infographic meant to "unravel the layers of success" might show icons for "Inception," "Growth," and "Present" without any connecting threads or data points explaining how one led to the other. The evolution is depicted, but the strategic decisions propelling it forward are absent.
Practical Advice: Before you choose a template or start designing, map out the information as a linear narrative or a hierarchical structure on paper. Decide if your story is chronological, comparative, or process-driven. Ensure every visual element—each color block, icon, or line—serves a specific purpose in that narrative. The "flat" aesthetic should frame a robust informational skeleton, not replace it.
Mistake 2: Overloading with Color and Sacrificing Clarity
The "colorful" aspect is a major draw, but it's frequently misapplied. A palette with too many competing hues or colors used without a semantic purpose (e.g., red for growth, green for risk) creates visual chaos. Beginners might think a vibrant infographic is more engaging, but for the audience, it becomes harder to follow the "strategic roadmap." The colors should guide the eye and categorize information, not just decorate.
Consider a typical business growth infographic. A better approach uses a primary color for the company's key metric, a secondary color for supporting factors, and a neutral shade for background elements. This creates a visual hierarchy. For instance, financial milestones could be in a consistent blue, while innovation milestones are in green, allowing the viewer to instantly differentiate themes within the overall journey.
What to Check Before You Begin
Ask yourself: Does each color have a meaning? Is my color scheme aiding comprehension or just attracting attention? Test your draft with someone unfamiliar with the topic. Can they describe the story or data flow based on the color cues alone? If not, your color strategy needs refinement.
Mistake 3: Ignoring the Audience's Context and Need
Many creators design with a generic "everyone" in mind. A Colorful Flat Infographic intended for a boardroom presentation needs a different data density and formality than one for a social media post aimed at consumers. A common error is using the same infographic for both, leading to ineffective communication. The professional audience may find it lacking detail, while the consumer audience may find it overly technical.
A Better Approach: Define your primary viewer. If your goal is to showcase your company's evolution to potential investors, the infographic should prioritize key financial and strategic milestones with supporting minimal data points. For a public audience, like blog readers or hobbyists, it should focus on relatable outcomes, brand story, and visual metaphors. The "dynamic visual representation" must be dynamic in its adaptability to context, not just in its appearance.
Mistake 4: Prioritizing Style Over Accessibility and Usability
In the pursuit of a clean, flat look, crucial functional details are often overlooked. This includes text legibility (font size against bold colors), the availability of a text-based summary for screen readers or those who prefer detailed reading, and the graphic's scalability. An infographic that is beautiful on a desktop but becomes an unreadable, pixelated blob when embedded in a mobile email newsletter fails its purpose. Its engagement is limited, and its potential for broad communication is lost.
Always test your final Colorful Flat Infographic in multiple formats: as a downloaded PDF, as an image on a website, and on a mobile screen. Ensure all text is readable without zooming. Consider providing the key data points in a simple list alongside the graphic. This thoughtful step ensures your visual voyage is inclusive and practical, not just aesthetically pleasing.
Evaluating a Pre-made Infographic
If you are downloading or buying a template, don't just evaluate its beauty. Scrutinize its structure. Can the sections be easily edited for your specific data? Does the color palette have logical groupings? Is there clear visual space for your headlines and annotations? A template that is rigidly styled but inflexible in layout will force you to cram your unique business story into a generic mold, diluting its impact.
Mistake 5: Assuming the Infographic is a Standalone Solution
The biggest overlooked detail is treating the Colorful Flat Infographic as the complete communication piece. It is a summary, a gateway. It should "encapsulate the essence" but not every detail. Expecting it to answer all possible questions leads to overcrowding. Conversely, publishing it without any supporting context—a blog post explaining the deeper strategy, a report with full data, or a verbal presentation—leaves the audience with a beautiful but potentially incomplete understanding.
Use the infographic as the anchor for a larger content piece. For example, publish the "visual voyage through the intricacies of our thriving business" on your website, but accompany it with a detailed article explaining each milestone. In a presentation, use the infographic as your roadmap slide, then dedicate subsequent slides to elaborating on each strategic decision. This layered approach satisfies both the quick-glance learner and the detail-seeking professional.
Ultimately, a successful Colorful Flat Infographic is a marriage of disciplined design and thoughtful communication. It requires you to balance the allure of color and simplicity with the rigor of information design. By avoiding these common pitfalls—by ensuring your graphic has substance, a purposeful color hierarchy, audience-specific tailoring, functional accessibility, and supportive context—you transform a simple visual into a powerful tool. It becomes not just a depiction of your journey, but a clear, engaging, and effective guide that truly unravels the layers of your success and invites others to understand and engage with your story.