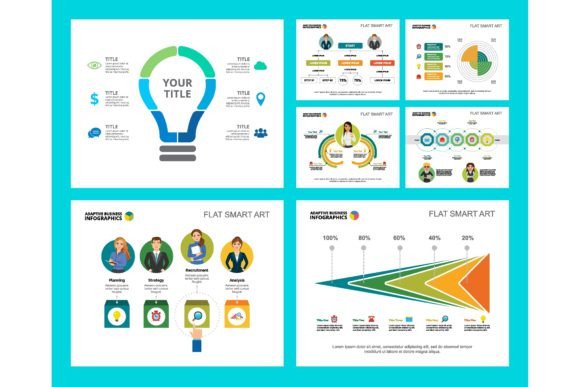
The Art of Visual Data: Using Colorful Research and Statistics Concepts Effectively
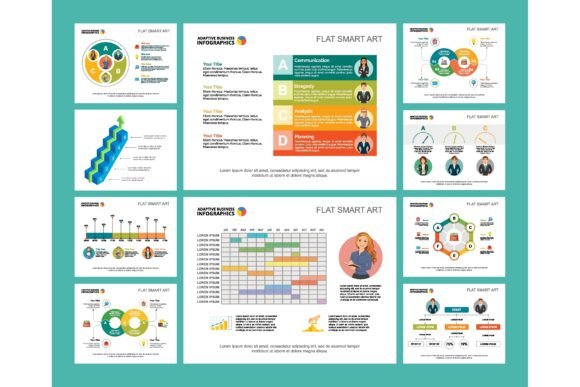
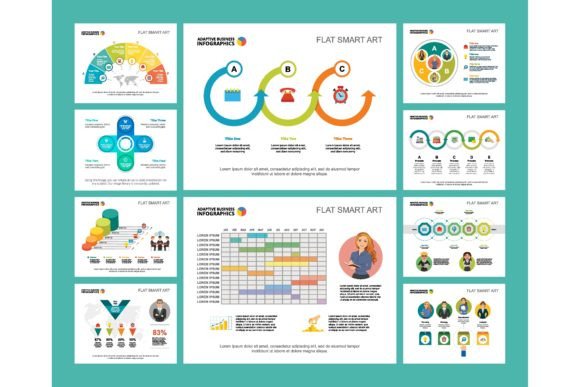
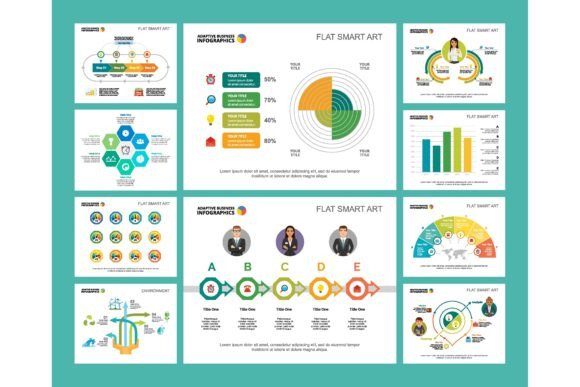
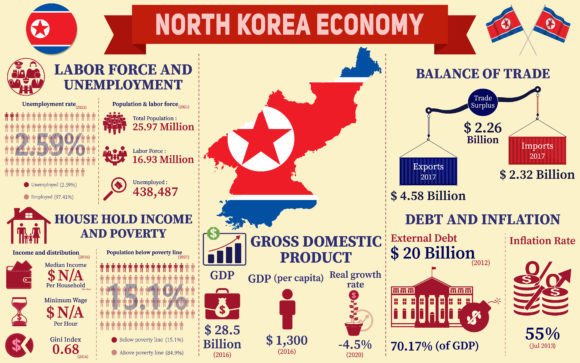
In today's information-rich environment, the ability to communicate data clearly and persuasively is paramount. A colorful research or statistics concept refers to the strategic use of visual design elements—like infographic charts, icons, and layouts—to transform raw numbers and complex findings into compelling, easy-to-understand stories. Whether you're preparing a financial report, designing a workflow layout, or creating a brochure, these visual tools are not just decoration; they are essential for engagement and comprehension. People are drawn to them because a well-designed chart can reveal trends in seconds, and a coherent layout can guide a viewer through a process intuitively, making your message stick.
Common Pitfalls in Visual Data Presentation
Despite their power, colorful statistics concept templates are often misused. One of the most frequent mistakes is the overemphasis on aesthetics over accuracy. It’s easy to get captivated by a vibrant palette or stylish icons and forget that the primary job of any data visualization is to represent information truthfully. Using a misleading chart scale or choosing colors that obscure differences can distort your message, leading audiences to draw incorrect conclusions. This not only damages your credibility but can also result in poor business decisions based on misread data.
Another overlooked detail is context stripping. When you download a generic infographic chart set, you might be tempted to plug in your numbers without adapting the visual framework to your specific story. For example, using a fancy 3D pie chart for data that compares ten different items will make it impossible to distinguish small slices, rendering the chart useless. The design should serve the data, not force the data into an unsuitable design.
Choosing the Right Tool for Your Message
A common misunderstanding is that any colorful research template will work for any purpose. This is not the case. Before selecting a template or design element, you must define your core message. Are you showing a change over time, a part-to-whole relationship, or a geographic distribution? Each requires a different chart type—line graphs, stacked bars, or maps. Using a workflow layout template for a financial performance report will confuse your audience because the visual language implies process steps, not fiscal results. The mismatch affects communication efficiency and can leave stakeholders dissatisfied with the clarity of your presentation.
Practical Advice for Effective Implementation
To avoid these mistakes, start with a content-first approach. Sketch your key findings or statistics on paper before you even open your design software. What is the one thing your audience must remember? Once that’s clear, you can then choose a colorful statistics concept element that amplifies that point. For instance, if your research highlights a dramatic growth spike, a simple but bold line chart with a strategically colored peak will be far more effective than a complex, multi-colored radar chart that drowns the highlight in noise.
When evaluating a template—whether for a presentation slide, a brochure, or a report—check its flexibility. Can you easily adjust the color scheme to align with your brand or to improve readability? Are the chart axes and labels editable? A good template provides a strong visual foundation but allows you to customize it deeply to fit your unique data context. Also, verify that the template includes a consistent set of icons and design elements so your entire document feels cohesive, not like a patchwork of stolen graphics.
The Balance of Color and Communication
Color is a powerful tool, but its misuse is a major source of poor usability. Avoid using colors solely because they are "colorful." Instead, use them with semantic purpose. For example, use a single, distinct color to draw attention to a critical data point or a step in a workflow. Use consistent colors across related charts to allow for easy comparison. Be mindful of accessibility: ensure there is sufficient contrast for viewers with color vision deficiencies and consider supporting color information with clear labels or patterns. This thoughtful approach enhances quality and ensures your communication is inclusive.
Let’s consider a realistic example. You’re creating a brochure about a new service rollout. A common poor choice would be to use five different, bright chart types on one page to show various metrics. The result is visual chaos. A better approach is to select one primary chart type (like a clean bar chart) for all comparative metrics, using a harmonious color palette with one accent color for the most important takeaway. Pair this with simple iconography in the workflow layout section to guide the reader. This creates a professional, digestible, and satisfying experience.
What to Check Before You Commit
Before downloading, buying, or applying a colorful research concept template, conduct a quick audit. First, look at the sample data used in the template demo. Does it represent a logical and accurate visualization? If the demo itself seems confusing, the template is flawed. Second, assess the file format and compatibility. Will it work smoothly with your software (e.g., PowerPoint, Illustrator, Canva)? A beautiful template that requires hours of technical adjustment to use is not efficient and increases project cost.
Finally, think about longevity. Is this design trendy but likely to look dated in a year? For financial reports and professional brochures, a timeless, clean design with strategic color use is often wiser than opting for the most vibrant, avant-garde option. Your goal is for the audience to focus on your research and statistics, not to be distracted by fleeting design fads.
Moving Forward with Confidence
Embracing colorful research and statistics concepts can elevate your communication from mundane to memorable. The key is to wield these tools with intention and restraint. Always let your data lead the design. Prioritize clarity and accuracy over sheer visual spectacle. By avoiding the common pitfalls of aesthetic overkill and context mismatch, and by choosing adaptable, purposeful templates, you empower your content to achieve its true goal: to inform, persuade, and inspire your diverse audience of professionals, entrepreneurs, educators, and consumers. Remember, the best visual is one that makes complex simple and the simple compelling.